
Every business now runs on servers whether it knows it or not. A shopping cart that hesitates for two extra seconds, a dashboard that times out during a sales call, an API that slows to a crawl during a traffic spike — these aren’t small inconveniences. They cost revenue, trust, and search rankings. That’s why server performance management has moved from a niche IT concern to a core business priority in 2026.
Server performance management is the ongoing practice of monitoring, analyzing, and tuning server resources — CPU, memory, disk I/O, and network throughput — so systems stay fast, stable, and predictable under real-world load. It’s not a one-time setup. It’s a continuous cycle of measurement and adjustment that touches everything from a single web server to a sprawling multi-cloud infrastructure.
This guide walks through everything you need to build a solid server performance management strategy: monitoring, analysis, capacity planning, load balancing, optimization techniques, common failure points, and the tools that make it all manageable.
Why Server Performance Management Matters More in 2026
Modern applications are more distributed than ever — microservices, containers, serverless functions, and multi-region deployments all add moving parts. Without disciplined server performance management, teams end up firefighting instead of preventing problems. A well-run server performance management program catches degradation before users notice it, which is far cheaper than an outage.
Server Monitoring: The Foundation
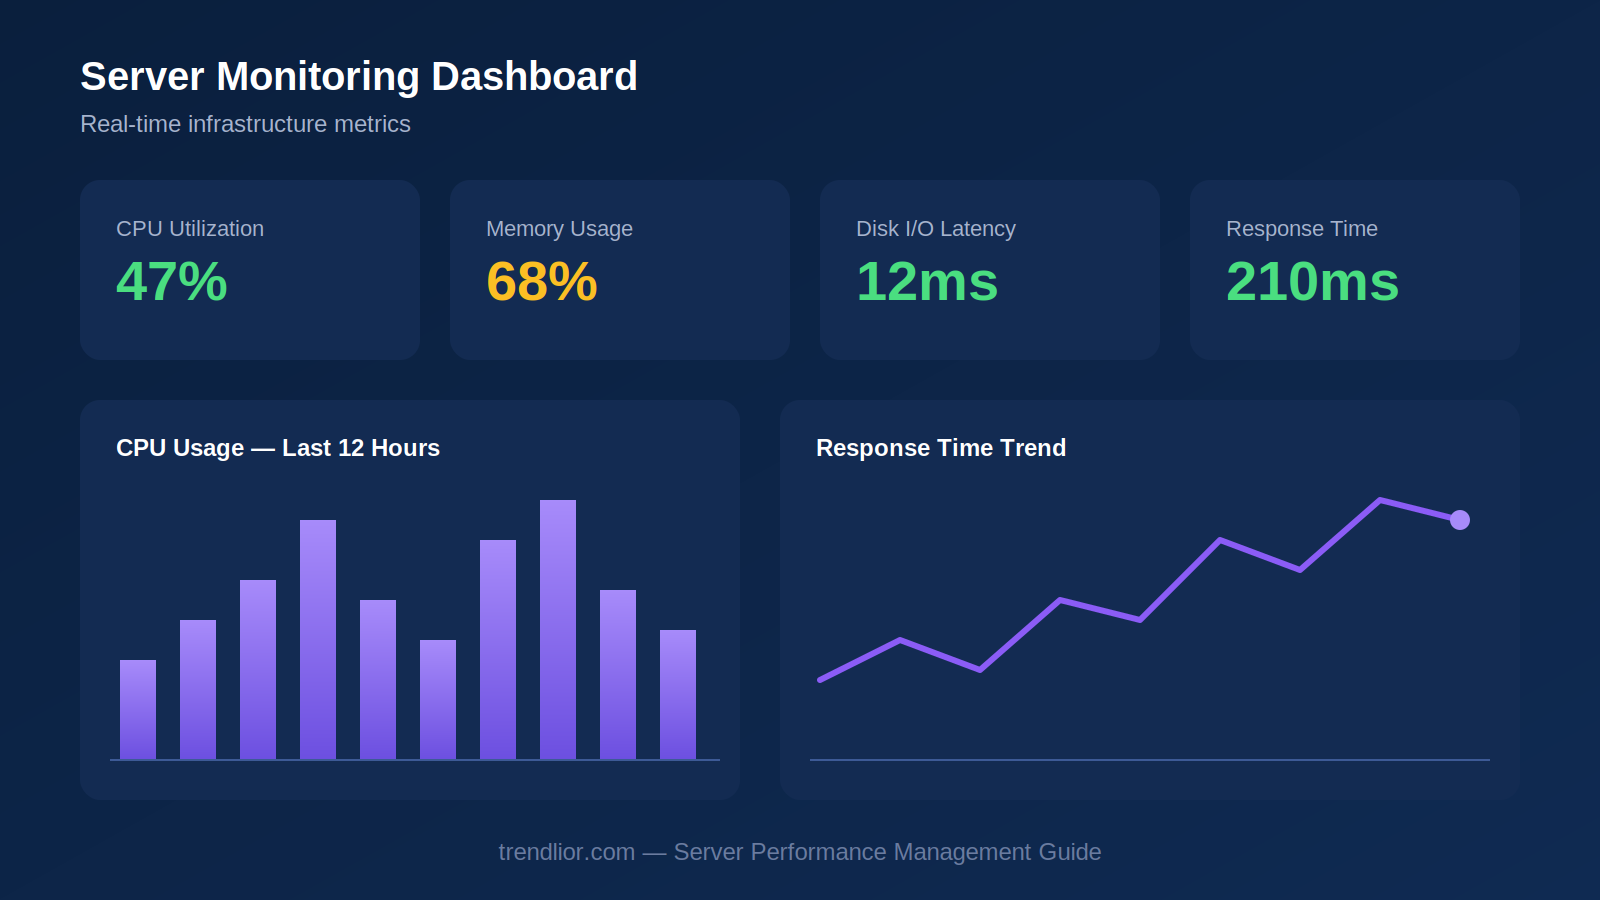
You can’t manage what you don’t measure. Server monitoring is the first pillar of any server performance management strategy, and it means continuously collecting metrics like CPU utilization, memory usage, disk latency, network throughput, and application response times.
Key Metrics to Track
- CPU utilization — sustained usage above 80% is a common early warning sign
- Memory pressure — swapping to disk is often the real cause of a “slow server”
- Disk I/O latency — especially critical for databases
- Network throughput and packet loss
- Application response time and error rate
Real-Time vs. Historical Monitoring
Real-time dashboards catch active incidents, while historical data reveals slow-building trends — like a memory leak that takes three weeks to become critical. Good server monitoring tools give you both views side by side, since a single snapshot rarely tells the whole story. Google’s Site Reliability Engineering book is a widely-cited reference for how to structure monitoring around symptoms rather than causes.
Performance Analysis: Turning Data Into Decisions
Collecting metrics is only useful if you analyze them correctly. Performance analysis is where server performance management earns its keep — it’s the process of interpreting monitoring data to find root causes, not just symptoms.
Common Analysis Techniques
- Baseline comparison — compare current metrics against normal historical patterns
- Correlation analysis — connect a spike in response time to a specific deploy, traffic surge, or backup job
- Bottleneck identification — determine whether CPU, memory, disk, or network is the limiting factor
A real-world example: an e-commerce company noticed checkout latency doubling every day at 2 PM. Analysis showed a scheduled database backup was competing for disk I/O with live transactions. The fix wasn’t more hardware — it was rescheduling the backup window, a five-minute change that resolved a problem the team had been chasing for weeks.
Capacity Planning: Staying Ahead of Demand
Capacity planning is the forward-looking half of server performance management. Instead of reacting to today’s load, you’re forecasting tomorrow’s — sizing infrastructure for growth, seasonal spikes, or product launches before they happen.
A Simple Capacity Planning Process
- Establish current baseline usage across CPU, memory, storage, and network
- Project growth using historical trends (traffic, users, data volume)
- Add headroom — most teams target 30-40% spare capacity for unexpected spikes
- Re-forecast quarterly, since growth rarely stays linear
Retailers planning for Black Friday or SaaS companies preparing for an end-of-quarter usage surge both rely on this cycle. Skipping capacity planning is one of the most common reasons infrastructure performance management efforts fail under real pressure. AWS’s own capacity planning guidance is a useful reference point even if you’re not fully on AWS, since the underlying principles apply across cloud providers..
Load Balancing: Distributing the Work
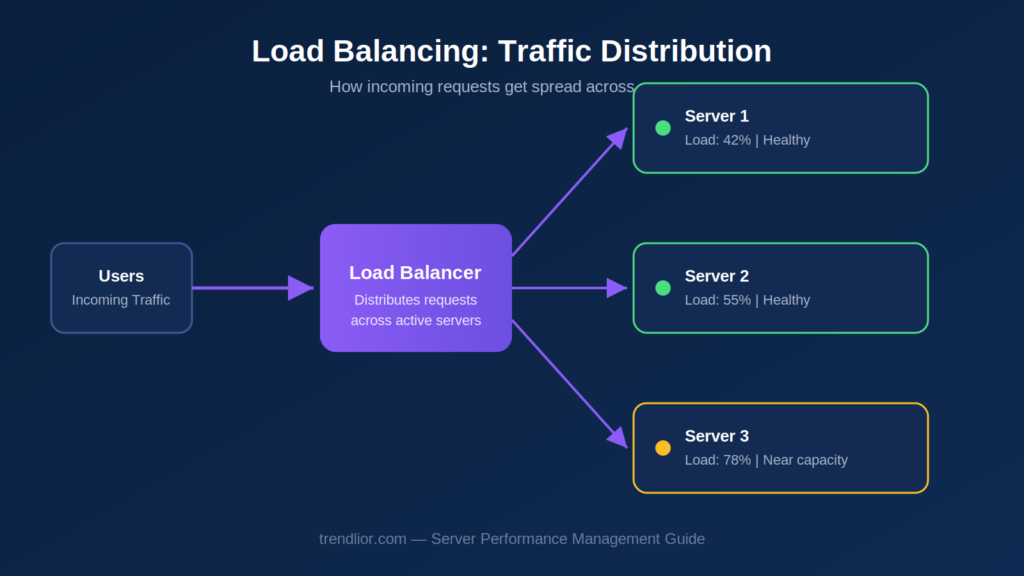
Load balancing spreads incoming traffic across multiple servers so no single node becomes a bottleneck. It’s central to both server performance management and cloud server performance, since cloud environments make horizontal scaling — adding more servers instead of bigger ones — much easier than traditional on-premises setups.
Common Load Balancing Methods
- Round robin — requests distributed evenly in sequence
- Least connections — routes traffic to the server currently handling the fewest requests
- Weighted distribution — accounts for servers with different capacities
- Geographic/latency-based routing — sends users to the nearest region
Pros and Cons of Load Balancing
| Pros | Cons |
|---|---|
| Improves uptime and fault tolerance | Adds architectural complexity |
| Enables horizontal scaling | Requires session/state management |
| Smooths out traffic spikes | Misconfiguration can mask real problems |
Server Optimization Techniques
Once monitoring, analysis, and capacity planning are in place, optimization is where you actively improve performance rather than just maintaining it.
Practical Server Optimization Techniques
- Caching — reduce repeated database or computation load with in-memory caches like Redis
- Database indexing and query tuning — often the single biggest performance win available
- Connection pooling — avoid the overhead of repeatedly opening new connections
- Compression — reduce payload size for faster network transfer
- Right-sizing instances — matching server specs to actual, not assumed, workload
- Auto-scaling — letting cloud infrastructure add or remove capacity automatically based on demand
Applied consistently, these server optimization techniques often deliver bigger gains than simply buying more hardware.
Common Server Issues (and How to Fix Them)
| Issue | Likely Cause | Fix |
|---|---|---|
| Sudden CPU spikes | Inefficient code, runaway process | Profile and optimize the offending process |
| Memory leaks | Application not releasing memory | Restart cycle short-term, code fix long-term |
| Slow disk I/O | Database contention, backup jobs | Reschedule jobs, upgrade to SSD/NVMe |
| Network latency | Poor routing, distant regions | Use a CDN or regional load balancing |
| Intermittent downtime | Misconfigured auto-scaling or health checks | Review scaling thresholds and health check logic |
“For distributed teams accessing infrastructure remotely, secure and performant network access matters just as much as the servers themselves — see our guide on Forcepoint SASE for how SASE architecture handles this.”
Best Server Monitoring Tools for 2026
| Tool | Best For | Pros | Cons |
|---|---|---|---|
| Datadog | Full-stack DevOps monitoring | Deep integrations, unified dashboards | Can get expensive at scale |
| Prometheus + Grafana | Open-source, self-hosted setups | Free, highly customizable | Steeper learning curve |
| New Relic | Application performance monitoring | Strong tracing and alerting | Pricing scales with data volume |
| Zabbix | On-premises infrastructure | Free, mature, flexible | Dated interface |
| AWS CloudWatch | Native cloud server performance | Deep AWS integration | Weaker outside AWS ecosystem |
Practical Steps to Improve Server Performance Today
- Set up baseline monitoring if you haven’t already
- Identify your top three resource bottlenecks this month
- Review and reschedule any jobs competing for disk I/O
- Add caching to your most frequently queried data
- Revisit capacity plans quarterly, not annually
- Test load balancing configuration under simulated peak traffic
FAQs
What is server performance management? Server performance management is the ongoing process of monitoring, analyzing, and optimizing server resources — CPU, memory, disk, and network — to keep systems fast and reliable under real-world load.
What’s the difference between server monitoring and server performance management? Server monitoring is one component — the data collection layer. Server performance management is the full cycle: monitoring, analysis, capacity planning, optimization, and ongoing tuning based on what the data shows.
How often should capacity planning be reviewed? Quarterly is a reasonable default for most growing businesses, with additional reviews ahead of known events like product launches or seasonal traffic spikes.
Do small businesses need dedicated DevOps monitoring tools? Yes, even a small setup benefits from basic monitoring — many tools, including Prometheus/Grafana and free tiers of commercial platforms, are accessible without a large budget or a dedicated DevOps team.
Can cloud server performance be managed the same way as on-premises servers? The core principles are the same, but cloud environments add auto-scaling, managed load balancing, and pay-as-you-go resource adjustment, which change how capacity planning and optimization are executed in practice.
Final Thoughts
Server performance management isn’t a single tool or a one-time project — it’s a discipline built from consistent monitoring, honest analysis, forward-looking capacity planning, smart load balancing, and steady optimization. Teams that treat infrastructure performance management as routine, rather than reactive, spend far less time firefighting and far more time building. Start with visibility, act on what the data shows, and revisit the plan regularly — that rhythm is what separates a server that merely runs from one that performs.